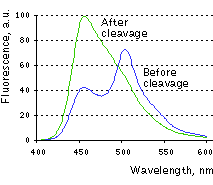
Change in Casper3-BG emission spectra upon the cleavage of DEVD sequence in vitro.
The excellent performance of
| Change in
|
|---|
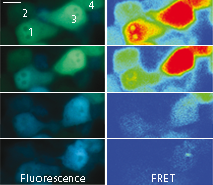 | 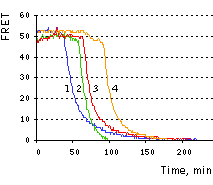 | Imaging of FRET intensity in staurosporine-treated HeLa cells.Cells treated with staurosporine are shown as overlaid fluorescent images of blue and green channels (left panels). The corrected FRET signals are shown in pseudocolor (right panels). Scale bar represents 10 μm. On the right, time course of corrected FRET signal for the four cells is shown. |
|---|