Approximately 30-40 min after 2 μM staurosporine infusion, cells demonstrated rapid (within 10 min) and pronounced changes in green-to-red fluorescence signal ratio, indicating activation of caspase-3. Later these cells demonstrated characteristic membrane blebbing. The average contrast in living cells (calculated as donor/acceptor emission ratio change for 5 cells, time point aligned to the median of ratio changes, individual for each cell) reached 3.8-fold.
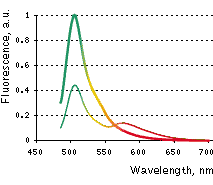 | Emission spectra of Casper3-GR before (thin line) and after digestion by Caspase-3 (thick line).
|
|---|
 |  |  | |
|---|
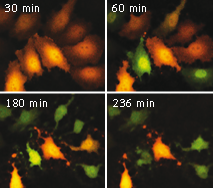
Casper3-GR upon staurosporine-induced apoptosis in HeLa cells.
Two channel fluorescence imaging of Casper3-GR upon staurosporine-induced apoptosis in HeLa cells. Time, in minutes, is shown after staurosporine infusion.
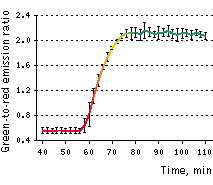
On the left graph, green-to-red emission ratio change of Casper3-GR upon staurosporine-induced apoptosis. Approximately 40-50 min after staurosporine infusion, cells demonstrated pronounced changes fluorescence signal ratio. Emission ratio shown for 5 cells, time point aligned to the median of ratio changes, individual for each cell. Excitation at 488 nm, emission was detected at 500-530 nm and 560-600 nm.
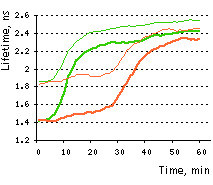
On the right graph, TagGFP fluorescence phase lifetime (thick lines) and average modulation lifetime (thin lines) changes for Casper3-GR during staurosporine-induced apoptosis. Excitation was at 488 nm and donor fluorescence emission was passed through a 500-530 nm bandpass filter.
|