|
Cyan-to-green photoswitchable fluorescent protein PS-CFP2
- Monomer, succesful perfomance in fusions
- Irreversible photoconversion from a cyan to a green fluorescent form
- High contrast of photoconversion
- High pH stability allowing labeling of acidic organelles
- Recommended for tracking cell, organelle, and protein movement, monitoring the protein turnover and superresolution imaging
 |
PS-CFP2 is an improved mutant of the photoswitchable monomeric fluorescent protein PS-CFP [Chudakov et al., 2004]. PS-CFP2 exhibits faster maturation and a brighter fluorescence both before and after photoswitching than its parental variant.
PS-CFP2 is capable of irreversible photoconversion from cyan to green fluorescent form in response to 405 nm light irradiation. It is recommended for real-time in vivo tracking movement of individual cells, organelles, and protein fractions [Chudakov et al., 2007]. It can also be applied for monitoring of the protein turnover at the single cell level [Zhang et al., 2007] and superresolution imaging by PALM [Shroff et al., 2007]. In addition, PS-CFP2 can be used as a routine cyan fluorescent tag (excitation maximum at 400 nm and emission maximum at 468 nm) at moderate excitation intensities and as a donor in FRET applications [Souslova and Chudakov, 2006].
|
Main properties
Normalized excitation (thin line) and emission (thick line) for non-activated (cyan) and activated (green) spectra.
Download PS-CFP2 spectra (xls)
| | CHARACTERISTIC | before / after photoactivation |
|---|
* Brightness is a product of extinction coefficient and quantum yield, divided by 1000.
| | Fluorescence color | cyan / green | | Excitation maximum, nm | 400 / 490 | | Emission maximum, nm | 468 / 511 | | Quantum yield | 0.20 / 0.23 | | Extinction coefficient, M-1cm-1 | 43 000 / 47 000 | | Brightness* | 8.6 / 10.8 | | pKa | 4.3 / 6.1 | | Activating light | UV-violet (e.g. 405 nm) | | Calculated contrast, fold | up to 2000 | | Structure | monomer | | Cell toxicity | not observed | | Aggregation | no | | Maturation rate at 37°C | fast | | Molecular weight, kDa | 27 | | Polypeptide length, aa | 238 | | Main advantages | Bright and pH stable routin cyan label, monomeric high-contrast irreversibly photoswitchable tag suitable for protein tracking |
|
|---|
Recommended antibodies, filter sets and laser lines
PS-CFP2 can be recognized using Anti-Tag(CGY)FP antibody (Cat.# AB121) or Anti-GFP antibody available from Evrogen.
Visualization before photoswitching: Before activation, PS-CFP2 produces cyan fluorescence with excitation and emission maxima at 400 and 468 nm, respectively. Standard levels of excitation do not cause significant photoswitching of cyan or photobleaching of green fluorescence.
PS-CFP2 excitation spectrum is absolutely different from that of common cyan fluorescent proteins, such as TagCFP, ECFP or Cerulean. Because of the shorter excitation wavelength, cyan fluorescence of PS-CFP2 can be easily separated from green fluorescence of its photoactivated state as well as from any green fluorescent protein. Therefore, common CFP filter sets are not optimal for PS-CFP2 visualization and photoactivation.
Recommended filter sets are: XF119-2*, XF131, XF06, XF03, XF11, XF129-2, XF05-2 (Omega Optical); DAPI-5060B* and DAPI-1160A (Semrock); 31037, 31041, 31016, 31021, 31000v2, 1009v2, 31013v2, 11005v2, 31047 (Chroma Technology Corp.).
* – preferred filter sets
Photoswitching: PS-CFP2 undergoes irreversible photoconversion (in response to intense 405 nm light irradiation) expressed in a decrease in cyan fluorescence and appearance of a 490 nm excitation peak with emission maximum at 511 nm.
Visualization after photoswitching: For visualization of green fluorescence of photoactivated PS-CFP2, filter sets used for routine GFPs visualization are recommended with excitation about 470-500 nm and emission collected at about 500-550 nm (e.g. Omega Optical XF100-2). Importantly, excitation wavelength must not be below 450 nm to avoid cross-excitation of non-photoactivated PS-CFP2.
Note: To avoid undesirable photoactivation of PS-CFP2 and photobleaching of its photoactivated form it is recommended that excitation light intensities and exposition times be minimized during visualization of both protein forms.
PS-CFP2 visualization, photoactivation and tracking in a confocal microscope: The following parameters are recommended for Leica microscope DMIRE2, confocal TCS-SP2, equipped with 25 mW 405 nm diode laser, 125 mW Ar laser, objective HCX-PL-APO-63x/1.40-0.60/OIL (parameters may vary for different experimental systems):
For visualization of PS-CFP2, we recommend the use of 405 nm laser excitation. In a scanning mode, 1-5% power of 405 nm laser causes only negligible PS-CFP2 photoactivation, and can thus be used for preliminary visualization. Fluorescence emission of nonphotoactivated PS-CFP2 can be collected from about 420 nm to about 510-530 nm to gain maximum signal.
For the fast PS-CFP2 photoactivation (which is required to track dynamics of rapidly moving protein of interest), we recommend using 50-100% power of 405 nm laser, 50-2000 ms irradiation in a point, using "point-bleach" mode in Leica confocal software. From our experience, "point-bleach" mode allows much faster photoactivation than any scanning modes, probably because of the continuity of irradiation. Tracking of a protein characterized by slow dynamics does not require fast photoactivation. In this case, high-power scanning of the ROI works perfectly well for PS-CFP2 photoactivation.
For photoactivated PS-CFP2, you can use 488 nm laser excitation and collect fluorescence emission between 500 nm to 550 nm. To avoid crosstalk, we recommend the use of sequential mode if you need to visualize both initial and photoactivated PS-CFP2. Use low intensity excitation light to avoid photobleaching.
Please refer also to the detailed protocol is published in Chudakov et al., 2007.
Performance and use
PS-CFP2 can be easily expressed and detected in a wide range of organisms. Mammalian cells transiently transfected with PS-CFP2 expression vectors display an evenly distributed cyan signal in 12-20 hrs after transfection. No cytotoxic effects are observed.
PS-CFP2 successful performance has been proven in many fusions including that with cytoplasmic β-actin, BH3 interacting domain death agonist (BID), nucleolar protein fibrillarin, and dopamine transporter (hDAT).
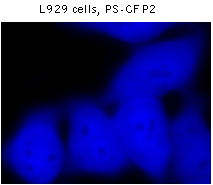 |  | Fluorescent microscopy of mammalian cells expressing PS-CFP2 protein.
|
|---|
High pH stability: Before photoactivation, PS-CFP2 exhibits a high pH stability with a pKa of 4.3. No changes are observed neither in the shape nor in the amplitude of fluorescence spectra within a pH range of 5.0 and 9.0. This makes it possible to target PS-CFP2 to acidic organelles such as endosomes and lysosomes. After photoswitching, PS-CFP2 has a pKa of 6.1, similar to that of other GFP-like proteins with a phenolate anion chromophore (e.g. EGFP).
High contrast of photoconversion: In response to intense 400 nm light irradiation, PS-CFP2 undergoes irreversible photoconversion expressed in a decrease in cyan fluorescence and appearance of a 490 nm excitation peak with emission maximum at 511 nm. After complete photoconversion, green fluorescence of PS-CFP2 increases more than 400 times, whereas the level of cyan fluorescence drops more than 5.5 times lower. The ratio of green fluorescence of the activated and inactivated form is four times higher for PS-CFP2 than for PA-GFP [Patterson and Lippincott-Schwartz, 2002]. Unlike that of PA-GFP, emission spectrum of PS-CFP2 changes completely, switching from cyan to green fluorescence. Thus, the increase in the green-to-cyan fluorescence ratio accounts for more than a 2000-fold contrast. Considerable decrease of cyan fluorescence during PS-CFP2 photoconversion provides a molecular tool for simultaneous tracking of both the movement of the photoactivated protein and its replacement with the non-activated form.
 | PS-CFP2 photoconversion in transiently transfected mammalian cells (movie).
L929 cells were transiently transfected with a plasmid encoding PS-CFP2 and tested under fluorescent microscope. Before photoswitching no detectable green fluorescence at FITC excitation was seen. In contrast, high-level signal was observed in cyan channel. Upon irradiation with 10-15 micro Joules (about 20-30 W/cm2) violet dye laser (404 nm) for a few seconds a fluorescence increase of more than 300-fold was observed in FITC channel.
|
|---|
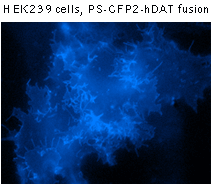
Suitability for tracking protein traffic has been demonstrated on example of PS-CFP (the parental variant of PS-CFP2) fused with the human dopamine transporter, hDAT [Chudakov et al., 2004]. PS-CFP-tagged hDAT was expressed in HEK293 cells. As expected, the fusion protein was localized in the cellular membranes. Then PS-CFP-hDAT was selectively photoswitched in the middle parts of two filopodia by short pulse of 404 nm laser irradiation. High contrast of photoconversion allowed monitoring hDAT movement precisely within thin filopodia in the vicinity of a big non-switched PS-CFP-hDAT pool at the filopodia base. At the same time, a decrease in the cyan fluorescence during photoswitching allowed monitoring non-switched PS-CFP-hDAT molecules entering the activated region.
 | Tracking PS-CFP-hDAT fusion movement within filopodia during 15 min (movie).
Signals in cyan and FITC channels are shown in red and green pseudocolors, respectively.
|
|---|
When expressed heterologously, hDAT is capable of endocytosis. To test whether early endosomes are able to exchange cargo proteins such as hDAT, PS-CFP-hDAT fusion was selectively photoswitched in several endosomes. Endosomes (both photolabeled and intact) were monitored within the whole cell for more than an hour after the photoactivation. They exhibited fast and rather chaotic intracellular movement. Two endosomes drew together to form a doublet. One of them contained photoswitched PS-CFP-hDAT and soon after their contact PS-CFP-hDAT mutual exchange between the endosomes was occurred: cyan fluorescence of the activated endosome recovered while green fluorescence of the second endosome grew.
 | Tracking of PS-CFP-hDAT fusion within early endosomes for 45 min (movie).
Signals in cyan and FITC channels are shown in red and green pseudocolors, respectively.
|
|---|
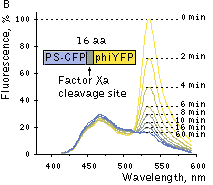
Suitability for FRET applications has been demonstated using a fusion construct comprising fluorescent donor (PS-CFP) and acceptor (PhiYFP) proteins with a linker containing Factor Xa protease cleavage site [Souslova and Chudakov, 2006]. In these fusions energy from the excited donor protein migrates partly to the acceptor due to FRET. Incubation of purified fusion constructs with Factor Xa protease eliminates FRET and leads to a gradual increase in the donor emission peak and a simultaneous decrease in the acceptor emission.
Excitation at 402 nm resulted in a substantial yellow fluorescence emission, showing effective FRET. Digestion of the linker between the two fluorescent proteins separated fluorophores and disrupted FRET. Increase in the donor-to-acceptor emission ratio after their separation reached 6.85-fold, which is better than that for any other reported GFP-like protein pairs.
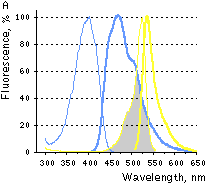 |  | FRET between PS-CFP and PhiYFP.
(A) Excitation (thin lines) and emission (thick lines) spectra of PS-CFP (blue) and phiYFP (yellow) are shown individually. Spectral overlap is filled with gray. (B) Emission spectra of the PS-CFP-Xa-phiYFP fusion are shown before (yellow) and at various time points after commencing digestion with Factor Xa protease (yellow-blue hues of the spectral lines). When excited at 400 nm the uncleaved construct emitted mainly yellow light that gradually dimmed upon cleavage of the linker.
|
|---|
PS-CFP2 can be used for careful determination of protein half-life as it has been described for Dendra2 in [Zhang et al., 2007]. In the method proposed, cells are transfected with a construct coding for target protein fused with a photoswitchable tag. A steady-state concentration of the fusion protein and corresponding fluorescent signal depends on protein synthesis and maturation rates as well as protein degradation rate. After photoconversion of the photoswitchable tag in a whole cell, a pool of distinct fluorescent molecules appears, which is independent of the synthesis and maturation of the new PAFP molecules. Thus, the decay of the activated fluorescence directly corresponds to the degradation of the PAFP-tagged protein. Time-lapse imaging of the activated signal allows for quantification of degradation process in real-time at the single cell level.
PS-CFP2 as a label for the dual-color superresolution imaging: Photoactivated localization microscopy (PALM) allows imaging of intracellular proteins at nanometer spatial resolution [Betzig et al., 2006]. Now it is possible to perform dual-color superresolution imaging using PS-CFP2 and second, green-to-red photoswitchable protein (like Dendra2) [Shroff et al., 2007]. It has been demonstrated that cyan-to-green photoactivation of PS-CFP2 works perfectly and, importantly, "higher spatial resolution can be obtained with PS-CFP2 than with Dronpa". Dual-color superresolution imaging using PS-CFP2 can reveal the spatial relationship between two proteins in whole fixed cells down to the nanometric level.
Available variants and fusions
| Variant | Description | Related vector | Cat.# |
|---|
|
|
Humanized PS-CFP2
|
PS-CFP was obtained from Aequorea coerulescens colorless GFP-like protein [Gurskaya et al., 2003]. As compared with PS-CFP, PS-CFP2 comprises S108T, M153V, and T154A substitutions, which lead to a much faster maturation and a brighter fluorescence both before and after photoswitching. PS-CFP2 codon usage is optimized for high expression in mammalian cells [Haas et al., 1996], but it can be successfully expressed in many other heterological systems.
|
pPS-CFP2-C
|
FP801
|
|
pPS-CFP2-N
|
FP802
|
References:
-
Betzig E, Patterson GH, Sougrat R, Lindwasser OW, Olenych S, Bonifacino JS, Davidson MW, Lippincott-Schwartz J, Hess HF.
Imaging intracellular fluorescent proteins at nanometer resolution.
Science. 2006; 313 (5793):1642-5. / pmid: 16902090
-
Chudakov DM, Lukyanov S, Lukyanov KA.
Tracking intracellular protein movements using photoswitchable fluorescent proteins PS-CFP2 and Dendra2.
Nat Protoc. 2007; 2 (8):2024-32. / pmid: 17703215
-
Chudakov DM, Verkhusha VV, Staroverov DB, Souslova EA, Lukyanov S, Lukyanov KA.
Photoswitchable cyan fluorescent protein for protein tracking.
Nat Biotechnol. 2004; 22 (11):1435-9. / pmid: 15502815
-
Gurskaya NG, Fradkov AF, Pounkova NI, Staroverov DB, Bulina ME, Yanushevich YG, Labas YA, Lukyanov S, Lukyanov KA.
A colourless green fluorescent protein homologue from the non-fluorescent hydromedusa Aequorea coerulescens and its fluorescent mutants.
Biochem J. 2003; 373 (Pt 2):403-8. / pmid: 12693991
-
Haas J, Park EC, Seed B.
Codon usage limitation in the expression of HIV-1 envelope glycoprotein.
Curr Biol. 1996; 6 (3):315-24. / pmid: 8805248
-
Patterson GH, Lippincott-Schwartz J.
A photoactivatable GFP for selective photolabeling of proteins and cells.
Science. 2002; 297 (5588):1873-7. / pmid: 12228718
-
Shroff H, Galbraith CG, Galbraith JA, White H, Gillette J, Olenych S, Davidson MW, Betzig E.
Dual-color superresolution imaging of genetically expressed probes within individual adhesion complexes.
Proc Natl Acad Sci U S A. 2007; 104 (51):20308-13. / pmid: 18077327
-
Souslova EA, Chudakov DM.
Photoswitchable cyan fluorescent protein as a FRET donor.
Microsc Res Tech. 2006; 69 (3):207-9. / pmid: 16538627
-
Zhang L, Gurskaya NG, Merzlyak EM, Staroverov DB, Mudrik NN, Samarkina ON, Vinokurov LM, Lukyanov S, Lukyanov KA.
Method for real-time monitoring of protein degradation at the single cell level.
Biotechniques. 2007; 42 (4):446, 448, 450. / pmid: 17489230
|